You open two betting sites. One offers 1.85. The other offers 1.92. At first glance, the difference feels insignificant. Most beginners would accept either price without hesitation. But over time, that small gap compounds. Across hundreds of bets, a few percentage points can determine whether you stay near break-even or slowly lose capital.
Odds are not predictions. They are prices attached to probability.
Odds = Probability + Margin
At their core, betting odds represent implied probability plus the bookmaker’s margin. In a perfectly fair market, a true 50% probability would be priced at 2.00, because 1 ÷ 2.00 equals 50%. Bookmakers do not offer fair odds. They adjust prices to include protection.
Instead of 2.00 and 2.00 in a balanced matchup, you might see 1.91 and 1.91. Converted back to probability, each side implies roughly 52.36%. Together, that exceeds 100%. The excess is the overround. This is how bookmakers guarantee long-term profit when action is balanced.
Odds Are Prices, Not Statements of Truth
Seeing odds as prices changes how you evaluate bets. If a team is listed at 1.50, the implied probability is about 66.7%. That does not mean the team wins 66.7% of the time. It means the bookmaker is offering that price.
The 1.85 vs 1.92 Scenario Revisited
Return to the opening example. One bookmaker offers 1.85. Another offers 1.92. Those prices imply approximately 54.05% and 52.08%. The gap appears small, yet it shifts your break-even point.
If you place 300 bets at slightly inferior prices, your long-term return declines even if your predictions remain accurate. Price selection influences profitability more than isolated results.
Why Odds Comparison Is a Structural Edge
Different bookmakers operate with different margins, risk models, and customer profiles. This creates pricing discrepancies. A consistent 1-2% improvement in average price can shift results from negative to neutral over time.
Even with a solid probability estimate, accepting inferior odds reduces expected return. Once you understand this, you stop trying to outguess outcomes and start evaluating whether the offered price is justified. That distinction separates casual betting from structured betting.
What Are Betting Odds?
Many beginners ask: What do betting odds mean? Betting odds show two things at the same time:
- How likely something is
- How much do you win if you’re right
Every time you look at sports odds, you are looking at probability and payout compressed into one number. The lower the odds, the more likely the outcome is considered. The higher the odds, the less likely it is – but the potential return increases.
Let’s use decimal odds because they are the clearest format. If the odds are 2.00, you double your money. A $10 bet returns $20 total – your stake plus $10 profit. In probability terms, 2.00 equals 50%.
If the odds are 1.50, the implied probability is 66.7%. A $10 bet returns $15 total – lower risk, lower reward.
If the odds are 3.00, the implied probability is 33.3%. A $10 bet returns $30 total – higher risk, larger reward.
The structure is consistent:
Lower odds → higher implied probability → smaller payout.
Higher odds → lower implied probability → larger payout.
This relationship is why learning how to read betting odds is not about format – it is about interpreting probability correctly.
Decimal Odds (Most Common in Europe & Africa)
Decimal odds are the simplest format because they directly multiply your stake.
The basic odds formula is:
Stake × Odds = Total Return
If you bet $25 at 1.80, you receive $45 total. Your profit is $20. For example, 1.92 is objectively better than 1.85 for the same outcome. No additional conversion is required.
Fractional Odds (Most Common in the UK)
Fractional odds show profit relative to your stake.
Example: 5/1
You win 5 units for every 1 unit staked. A £10 bet returns £60 total (£50 profit + £10 stake).
Example: 1/2
You win 1 unit for every 2 units staked. A £10 bet returns £15 total (£5 profit).
Fractional odds focus on profit first, not total return. The underlying probability remains the same as in decimal format – only the presentation differs.
American Betting Odds
American betting odds use positive and negative numbers.
Positive odds (for example +200) show how much profit you make on a $100 stake. A $100 bet at +200 returns $300 total.
Negative odds (for example -150) show how much you must risk to win $100 profit. At -150, you risk $150 to win $100.
If you want US betting odds explained clearly, focus on what plus and minus in betting represent: profit relative to a base amount.
Positive numbers usually indicate underdogs. Negative numbers indicate favorites.
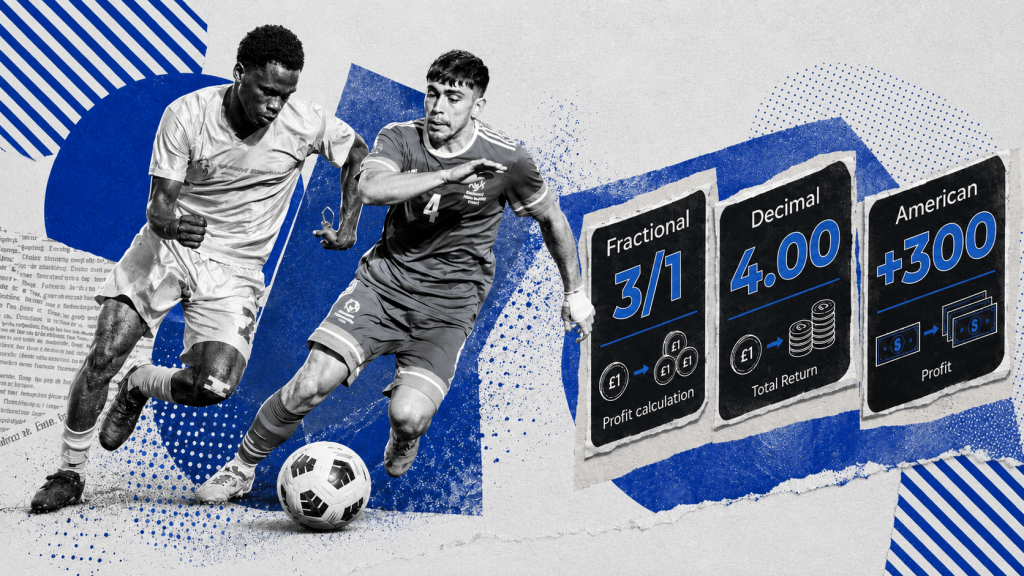
Comparison Table
| Decimal | Fractional | American | Implied Probability |
| 2.00 | 1/1 | +100 | 50% |
| 1.50 | 1/2 | -200 | 66.7% |
| 3.00 | 2/1 | +200 | 33.3% |
| 1.80 | 4/5 | -125 | 55.5% |
Regardless of format, betting odds always communicate probability and potential return in one number. Understanding this is not about memorizing different systems. It is about recognizing that every bet is a trade-off between likelihood and payout.
Once you can calculate betting odds, convert odds to percentages, and read sports odds correctly, you stop reacting to large payouts and start evaluating prices rationally.
How Bookmakers Actually Set Odds
How bookmakers set odds in 3 steps:
- Estimate the true probability using statistical models and data
- Add margin (overround) to ensure long-term profit
- Adjust the price based on betting volume and market movement
Many people assume bookmakers simply predict the future. In reality, bookmakers’ odds are built through a structured, layered process. First comes probability. Then margin. Then the market reaction.
To understand how gambling odds are created, you need to see each stage clearly.
Step 1 – True Probability Calculation
Before any margin is added, bookmakers calculate an internal estimate of true probability.
They rely on:
- Statistical models
- Historical performance data
- Team strength ratings
- Injury reports
- Tactical matchups
Advanced models evaluate scoring rates, defensive efficiency, expected goals, tempo, matchup dynamics, and historical performance patterns. Team strength is often represented through internal rating systems similar to ELO-style calculations.
Injuries and tactical structures matter because they shift measurable probability. A missing striker reduces expected scoring output. A high-pressing team facing a counter-attacking opponent creates structural matchup risk.
At this stage, bookmakers are effectively answering one question: what is the most realistic probability of each outcome?
This is the foundation of how betting odds work before the margin is applied.
Step 2 – Adding the Bookmaker Margin (Overround)
Bookmakers are businesses. They require structural profit over time. To achieve that, they adjust probabilities upward. This is known as the margin or overround.
Imagine a perfectly balanced football match where each outcome has a true 33% probability.
True probability:
- Home win – 33%
- Draw – 33%
- Away win – 33%
Together, this equals 100%.
Now the margin is applied:
- Home win – 36%
- Draw – 36%
- Away win – 36%
Total: 108%.
That additional 8% represents the bookmaker’s built-in edge.
Instead of offering fair odds near 3.00 (which reflect 33%), the bookmaker offers lower prices reflecting 36%. The payout decreases slightly, and that difference guarantees long-term protection if action is balanced.
This is why betting odds explained properly always include margin. Odds are not neutral probabilities. They are probabilities adjusted for profit.
Step 3 – Market Adjustment
After publication, odds do not remain static. They move.
Bookmakers monitor incoming bets and adjust prices to manage liability. If heavy money comes in on one side, odds shift to reduce exposure. This is risk control, not emotional reaction.
Sharp bettors influence markets early. When respected accounts place large wagers, bookmakers treat that money as information and adjust lines quickly.
Public money behaves differently. Popular clubs such as Manchester United or FC Barcelona attract bets regardless of price. Because demand is predictable, bookmakers may slightly shade lines toward public favorites.
News also triggers movement. Late injuries, lineup changes, tactical shifts, or in-play events during live betting force immediate price updates. This is often when you see dropping odds – not because the outcome became certain, but because risk exposure changed.
The final number you see is not a prediction. It is a managed price built through models, protection mechanisms, and market response.
Why Odds Differ Between Betting Sites
You may see 1.88 at one bookmaker and 1.94 at another for the same event. The teams, kickoff time, and market are identical. The price is not. Differences in bookmakers’ odds usually come from three structural factors:
- Margin (overround)
- Business model
- Market liquidity
Margin & Overround
Every bookmaker embeds a margin into its pricing. That margin varies by operator. In a two-outcome market with a true 50% probability on each side:
- A low-margin bookmaker might offer 1.95 – 1.95
- A higher-margin bookmaker might offer 1.88 – 1.88
Converted to implied probability:
- 1.95 → 51.28%
- 1.88 → 53.19%
The higher implied percentage reflects a larger overround. The event is the same, but the cost of participation differs.
Business Model
Some bookmakers target recreational bettors and prioritize marketing, bonuses, and wide margins. Others compete primarily on price and operate with tighter spreads.
Sharper books often react faster to market information and may limit winning accounts. Recreational books may offer softer lines but embed higher protection.
Pricing strategy depends on customer profile, not just probability estimates.
Liquidity & Market Depth
Liquidity also affects price differences.
High-volume leagues (e.g., major European football competitions) typically have tighter pricing because money flows from many participants. Smaller leagues or niche markets often show wider spreads due to lower liquidity and higher uncertainty.
The less liquid the market, the more variation you are likely to see between operators.
Comparing bookmakers is not about chasing random gaps. It is about identifying which platform consistently offers tighter pricing for the markets you play.
How to Read Betting Odds
To read betting odds correctly, focus on what the number represents: implied probability and potential payout.
Every price answers two questions:
- How likely is the outcome?
- How much do you win if it happens?
Take decimal odds of 1.80. This does not mean “almost double.” It implies roughly 55.5% probability and returns 1.80 times your stake.
To convert odds into probability:
Implied probability = 1 ÷ Decimal Odds
Examples:
- 2.00 → 50%
- 1.50 → 66.7%
- 3.00 → 33.3%
- 1.80 → 55.5%
Once you convert the number, you can compare it to your own estimate.
If you believe a team wins 60% of the time and the bookmaker offers 1.80 (55.5%), the price may offer value.
If the bookmaker offers 1.65 (60.6%), the price already reflects that probability.
Lower odds do not mean safe. Higher odds do not mean valuable. The only relevant question is whether the implied probability is lower or higher than your realistic assessment.
Reading odds correctly is simply converting the price into a percentage and comparing it to your estimate.
Understanding Implied Probability
Implied probability is the likelihood suggested by the betting odds themselves. It is not the true probability of an event – it is the bookmaker’s priced probability.
Crucially, implied probability includes margin.
In a two-outcome market:
Team A – 1.90 → 52.6%
Team B – 1.90 → 52.6%
Total = 105.2%
The extra 5.2% above 100% is the overround – the bookmaker’s built-in edge.
This is why implied probability differs from true probability. The numbers reflect a managed price that includes profit protection, not a neutral statistical estimate.
Understanding this distinction prevents a common mistake: treating odds as objective truth rather than adjusted market pricing.
How to Compare Odds
Odds comparison is a practical process. The goal is simple: enter the market at the best available price.
Here is the workflow.
1. Check at Least 2-3 Bookmakers
Prices vary between operators due to margin, risk tolerance, and liquidity.
Example:
- Site A – 1.87
- Site B – 1.91
- Site C – 1.94
The event is identical. The probability estimate is similar. The difference is pricing.
Before placing a bet, confirm that the selected bookmaker offers the highest available odds for that market.
2. Monitor Closing Line Value (CLV)
Closing Line Value measures how your entry price compares to the final market price before kickoff.
- If you bet at 1.95 and the line closes at 1.80, your entry was stronger than the closing market.
- If you bet at 1.80 and the line closes at 1.95, you entered at a weaker price.
Over time, consistently beating the closing line suggests that your entries align with efficient pricing.
CLV evaluates decision quality independently of short-term results.
3. Verify Implied Probability
Before confirming a bet, convert the price into a percentage.
1.90 → 52.6%
1.95 → 51.3%
If your probability estimate is 53%, 1.95 may offer an acceptable value while 1.90 may not.
Comparing odds only makes sense when you evaluate them in probability terms.
4. Use Odds Comparison Websites
In addition to manually checking bookmakers, there are dedicated odds comparison platforms that aggregate prices in real time. These tools make the process faster and more efficient, especially when you want to scan multiple operators at once.
For more advanced users, these platforms can also help spot line movement trends and differences between markets
Odds in Different Sports
Betting odds follow the same mathematical structure in every sport, but how they behave depends on the nature of the event. Scoring frequency, number of possible outcomes, liquidity, and volatility all influence pricing.
Football
To understand how odds work in football, you must start with market structure.
Football (soccer) is typically a three-outcome market: home win, draw, or away win. Unlike tennis or basketball, where there are usually only two possible results, football requires probability to be distributed across three outcomes.
That alone increases complexity and often increases overall overround compared to simple two-way markets.
Because scoring is relatively low, one goal can dramatically shift the implied probability. This creates tighter pricing around favorites and more compressed bookmakers’ odds overall.
Example:
Home – 2.10
Draw – 3.30
Away – 3.60
The bookmaker must distribute probability across all three results while embedding a margin. Small changes in team news, tactical adjustments, or late injuries can shift prices quickly.
Public bias is also stronger in football. Big clubs attract betting volume regardless of price. That demand can slightly distort lines compared to less popular teams, especially in high-profile leagues.
Lower scoring variance means injuries or lineup changes have a larger measurable impact than in high-scoring sports. A missing striker in football often affects probability more noticeably than a single player’s absence in basketball.
Horse Racing
Horse racing operates under very different dynamics.
Instead of two or three outcomes, there may be 8, 12, or even 20 runners. That expands the total probability distribution and significantly increases the overround. As a result, margins in horse racing markets are typically higher than in major football leagues.
Each horse is priced individually based on:
- Past performance
- Track conditions
- Distance suitability
- Jockey
- Stable form
Unlike team sports, where probability adjustments are often gradual, horse racing odds can move sharply close to race time as money enters the market. Late shifts frequently reflect both new information and betting volume concentration.
Public sentiment also plays a role. Well-known horses often attract disproportionate betting, compressing their price regardless of whether the probability justifies it.
Variance is another major difference. In horse racing, longshots win more frequently than beginners expect because of the larger field and wider distribution of outcomes. This is why gambling odds in racing often range far more widely than in football.
While football markets typically revolve around prices between 1.40 and 4.00, horse racing can range from 1.20 to 50.00 or higher.
The structure remains consistent: probability plus margin. What changes is distribution width and volatility.
Understanding how betting odds behave across different sports helps you interpret price movements more accurately.
Key Takeaways
- Bookmakers set odds in three stages: estimate probability, add margin, then adjust for market movement.
- All odds include built-in margin (overround), which creates the bookmaker’s structural edge.
- Price differences between bookmakers come from margin, business model, and liquidity – not from different matches.
FAQ – Common Questions About Betting Odds
Which odds are likely to win?
No odds are “likely to win” on their own. Lower odds reflect higher implied probability, but that does not guarantee success. For example, 1.30 suggests a strong favorite, yet even favorites lose regularly. Instead of asking which odds are likely to win, the better question is whether the implied probability is lower than your realistic estimate.
What are good odds?
There is no universal definition of good odds. Good odds are simply prices that are higher than the true probability of an outcome. Good odds are relative, not absolute.
What does “dropping odds” mean?
Dropping odds refer to a price decreasing over time. For example, if a team moves from 2.10 to 1.85, the market is implying increased probability.
This movement can be caused by:
- Heavy betting volume
- Sharp bettors placing large wagers
- Injury news
- Tactical updates
Dropping odds do not guarantee a win. They indicate market adjustment.
What are gambling odds and how are they calculated?
Gambling odds represent probability adjusted with bookmaker’s margin. To calculate betting odds in decimal format, bookmakers first estimate true probability and then add overround.
How do American betting odds work?
American betting odds use positive and negative numbers.
Positive odds (for example +200) show how much profit you make on a $100 stake.
Negative odds (for example -150) show how much you must risk to win $100.
The plus and minus in betting simply express the payout structure. The underlying probability principle remains identical to decimal odds.
Can you know the winning odds in advance?
You cannot know the winning odds with certainty. Odds reflect probability, not guarantees.